-
Recent Posts
Archives
Category Archives: visualization
Sample piano roll output
This graphic presents a demonstration of piano rolls for separate instruments, which our J-DISC tools should be able to identify in future development stages. (Please click on the image to enlarge in a new window.)
Posted in J-DISC Use cases, visualization
Comments Off on Sample piano roll output
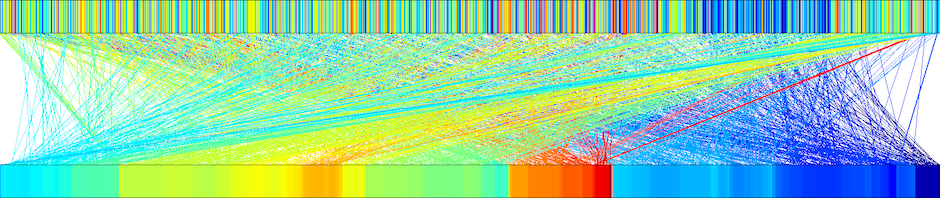
Visualizing onset correlation
As Tad mentioned in previous posts, rhythmic variation is one of the key distinguishing features of jazz. We’ve been specifically interested in analyzing how drummers can create a different feel by playing “ahead of” or “behind” the beat (whatever that … Continue reading
Posted in rhythm, visualization
Comments Off on Visualizing onset correlation