week2
We used RTcmix, Max/MSP and showed a JSyn example for our class
demos. For the attractor-realization applications, RTcmix was
imbedded in a wxWindows graphics context. See the
resources
web page for appropriate links to these packages.
Links
Code
Here are the source-code files for the class examples:
- popeq.sit -- Luke's Max/MSP realization
of the "population equation"
- lorenz.tar.gz -- development of
the Lorenz attractor sonification app
- henon.tar.gz -- development of
the Henon attractor sonification app
We talked about different ways of "doing" algorithmic composition and
demonstrated some simple scorefiles (scripts) to show probabilistic
and deterministic approaches (see below). We also looked at times
where probabilistic/deterministic techniques overlap -- constrained
probabilities and chaotic equations.
Simple Algorithmic Scorefiles
Our first little scorefile showed a very simple 'algorithmic'
operation -- creating a scale (both logarithmic and linear). A variant
of this deterministic approach uses the bottom part of a simple parabola
(y = x2), mapping it into a frequency range we can
hear and stepping through the range [-1.0, 1.0] to generate our
notes:
rtsetparams(44100, 2)
load ("WAVETABLE")
reset(44100)
makegen(1, 24, 1000, 0,0, 1,1, 2, 0)
makegen(2, 10, 1000, 1.0, 0.3, 0.1)
start = 0
x = -1.0
for (i = 0; i < 20; i = i+ 1)
{
y = x*x
pitch = y * 1000.0 + 100.0
WAVETABLE(start, 0.2, 30000, pitch, 0.5)
start = start + 0.1
x = x+0.1
}
Next we explored the use of constrained randomness, ultimately winding
up with a little scorefile to create a narrowing/widening effect on
our note pitches (the widening was a happy byproduct of sloppy
programming -- yay!):
rtsetparams(44100, 2)
load ("WAVETABLE")
reset(44100)
srand(8)
makegen(1, 24, 1000, 0,0, 1,1, 2, 0)
makegen(2, 10, 1000, 1.0, 0.3, 0.1)
start = 0
low = 100
high = 1000
for (i = 0; i < 150; i = i+ 1)
{
pitch = irand(low, high)
WAVETABLE(start, 0.2, 10000, pitch, 0.5)
start = start + 0.03
low = low+10
high = high-10
}
Finally, we wrote a simple scorefile that did a fun sort of
'spectral decomposition'. We started by generating the aligned
harmonics of a sawtooth waveform. We then gradually randomized
the start time of each harmonic, ultimately resulting in a
cascading effect through the harmonic spectrum:
rtsetparams(44100, 2)
load ("WAVETABLE")
reset(44100)
makegen(1, 24, 1000, 0,0, 1,1, 5, 0)
makegen(2, 10, 1000, 1.0)
start = 0
pitchbase = 149.78
ampbase = 20000
lo = 0.0
hi = 0.001
for (i = 0; i < 50; i = i+1)
{
for (j = 1; j < 20; j = j + 1)
{
pitch = j*pitchbase
amp = ampbase * (1/j)
hstart = start + irand(lo, hi)
WAVETABLE(hstart, 0.2, amp, pitch, 0.5)
}
hi = hi + 0.007
start = start + 0.2
}
Not content with that, of course we then began to randomize the frequency
of each harmonic. What fun:
rtsetparams(44100, 2)
load ("WAVETABLE")
reset(44100)
makegen(1, 24, 1000, 0,0, 1,1, 5, 0)
makegen(2, 10, 1000, 1.0)
start = 0
pitchbase = 149.78
ampbase = 20000
lo = 0.0
hi = 0.001
plo = 0.0
phi = 1.0
for (i = 0; i < 50; i = i+1)
{
for (j = 1; j < 20; j = j + 1)
{
pitch = j*pitchbase
hpitch = pitch + irand(plo, phi)
amp = ampbase * (1/j)
hstart = start + irand(lo, hi)
WAVETABLE(hstart, 0.2, amp, hpitch, 0.5)
}
hi = hi + 0.007
phi = phi + 2.0
start = start + 0.2
}
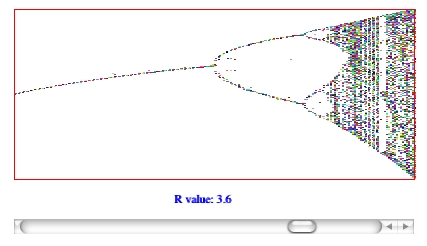
Chaotic Attractors: The Population Equation
The first chaotic equation we tried was the famous "population equation":
This equation was made famous in James Gleick's book Chaos: the Making
of a New Science. When plotted by changing the value of
R and iterating the equation, we can see regions of relative
stability (single or double values are always generated) interspersed
with areas of chaotic behaviour:
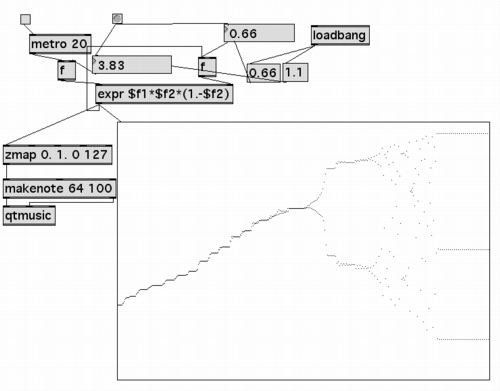
Mapping the output of the equation onto pitch seemed like a logical thing
to do, so we did. Luke Dubois has also created a nifty Max/MSP patch
that uses this equation (available at the top of this web page):
Chaotic Attractors: The Lorenz Attractor
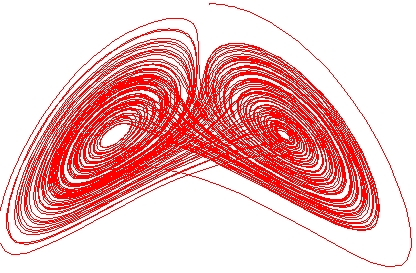 The Lorenz attractor is generated by iterating the following three
differential equations,
and plotting x against z after calculating the
delta-difference for the points x, y and z:
The Lorenz attractor is generated by iterating the following three
differential equations,
and plotting x against z after calculating the
delta-difference for the points x, y and z:
dx/dt = a(y-x)
dy/dt = bx - y - zx
dz/dt = xy -cz
Because we were always plotting tiny delta-differences in the values
of x and z, the graph was nicely connected, and by
inserting a small amount of time between each point plotted we could
observe the plot as it orbited around one basin of attraction and then
jumped into the other (the characteristic behavior of the Lorenz
attractor -- originally developed as an atmospheric/climate model).
The obvious thing for us computer-musicians to do is to realize this
as a graph of frequency vs. amplitude and listen as the merry
Lorenz attractor unfolded itself. Oh what fun!
Chaotic Attractors: The Henon Attractor
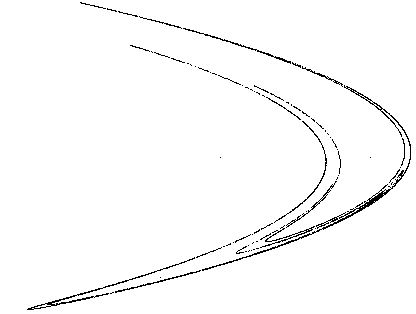
The Henon attractor presented a slightly different challenge in
sonic interpretation. The attractor is generated in a fashion almost
as simple as the chaotic population equation described earlier.
Simply iterate the following two equations:
xn = yn-1 - axn-12 + 1
yn = bxn-1
Plotting the [x,y] pairs that come from the above will ultimate
generate the attractor.
The tricky part is that, like the population equation in one of the
chaotic regimes, the points jump randomly along the attractor
orbit. If we just played these notes as pitches, then it would
sound like random notes.
Instead, we imagined trying to capture the 'essence' of the attractor-filling
process, because essence-capturing sure seemed like a good idea at the time.
We treated the graph above as a simplified spectral (FFT) plot for
a 2-second chunk of time, and repeatedly realized it as we plotted
10 points for each 2-second burst. As the attractor filled in, the
initially schematic sound of the swooping attractor gradually became
a more coherent musical gesture. Sort of.
There's a whole lot more fun to be had with these algorithmic entities.
I think the key to really doing something interesting is to think
beyond the simple, straightforward realizations that we made for
class demo purposes. Mapping our plots onto frequency (even as
spectra) makes a kind of intuitive sense, but surely there is an
undiscovered sonic landscape awaiting the creative individual who
can imagine even more rewarding uses of these approaches.